
Within this article, we discuss what Earned Value Management (EVM) is and how it is used on megaprojects. We also discuss how to interpret the EVM metrics and how EVM can show integration of project data.
What is Earned Value?
Earned value is a project management metric that provides a measurement of the value of work completed at a given point in time, which in turn allows cost and schedule performance to be assessed against the plan.
An Earned Value Management System (EVMS) integrates the entire work scope of a project with cost and schedule elements to efficiently plan, monitor, assess, and control a project. The EVMS takes the work scope and breaks it down into smaller manageable units of work, which are each assigned a cost and schedule value. These initial cost and schedule values (planned or budget values) are then compared against the actual cost and schedule values incurred to objectively assess the actual work performance, specifically how close was the actual work performance to the initial planned estimates. These variances between planned and actual performance are then used to forecast the future performance to prepare cost and schedule estimates at completion and allow project management to make informed decisions based on the observed performance to date.
How Does EVM Integrate Project Data?
EVM integrates the three core elements of a project (scope, time, and cost) to allow them to be measured against common units of progress. Instead of the project tracking costs and schedule separately, EVM converts both into a single metric of earned value that shows the value of work accomplished compared to the plan.
The four core measures that support EVM are:
PV = Planned Value (Budgeted Cost of Work Scheduled), the budgeted value of work the project planned to complete by a certain point of time.
EV = Earned Value (Budgeted Cost of Work Performed), the cost of the work that has been performed.
AC = Actual Cost, the actual amount of money the project has spent.
BAC = Budget at Completion, the total budget for all work to be performed on the project.
Because EV is usually provided in dollars, it is the bridge between the schedule and cost. Comparing EV to PV gives you the project’s schedule performance defined as Schedule Variance or “SV”. Comparing EV to AC gives you the project’s cost performance defined as Cost Variance or “CV”. Both these comparisons use the same value of the work performed baseline to ensure there is a logical tie between cost and schedule.
Including CV and SV, commonly used EVM metrics include:
Cost Variance (CV) = EV - AC, provides the amount of budget surplus or deficit based on the value of the work completed to date; a positive CV indicates cost less than planned, while a negative CV indicates costs above the plan.
Schedule Variance (SV) = EV - PV, provides the amount of work completed compared to the plan for a given point in time; a positive SV indicates the project is ahead of schedule, while a negative CV indicates the project is behind schedule.
Variance at Completion (VAC) = BAC - Estimate at Completion (EAC), provides the estimated difference in cost to complete the project compared to the budget; a positive VAC indicates the project is trending under budget, while a negative VAC indicates the project is trending over budget.
Schedule Performance Index (SPI) = EV / PV, provides a time-focused view of how efficient the work performed has been against that plan; a SPI greater than 1.0 indicates the project is ahead of schedule, while less than 1.0 indicates the project is behind schedule.
Cost Performance Index (CPI) = EV / AC, provides a cost-focused view of how efficient the work performed has been against the plan; a CPI greater than 1.0 indicates the project is trending under the budget, while less than 1.0 indicates the project is trending over budget.
Estimate to Complete (ETC) = EAC – AC, if the work is progressing as planned the cost of completing the work can be calculated simply by deducting actual costs from the estimate at completion. If the work has diverted significantly from the plan, a bottoms-up estimate to complete should be initiated.
Estimate at Completion (EAC) = BAC / CPI, provides the expected total cost of completing the project using the current CPI. Variations of this formula include:
EAC = AC + BAC – EV, for scenarios when future work is expected to be completed at the planned rate.
EAC = AC + Bottoms-up ETC, for scenarios where the initial plan is no longer valid.
EAC = AC + [(BAC – EV) / (CPI x SPI)], for scenarios when the CPI and SPI influence the remaining work.
To-Complete Cost Performance Index (TCPI), provides a view of the cost performance that must be achieved to reach a specified target as expressed by the ratio of the cost to finish the outstanding work to the available budget. For example, with a TCPI of 1.25 it indicates that for each unit of cost, 1.25 units of work will be required (or $1 of costs producing $1.25 of work) in order for the project to be completed at its current budget or estimate. TCPI can be calculated using the initial plan or an updated EAC:
TPCI = (BAC – EV) / (BAC – AC), shows the cost performance efficiency that must be maintained in order to complete the project as planned.
TPCI = (BAC – EV) / (EAC – AC), shows the cost performance efficiency that must be maintained in order to complete the project at its current EAC.
To-Complete Schedule Performance Index (TSPI), like its TCPI cousin, TSPI provides a view of the schedule performance that must be achieved to reach a specified target. For example, with a TSPI of 1.25 it indicates that for the time remaining on the project, where 1 unit of work was planned to be accomplished in a given unit of time, 1.25 units of work must be completed for the project to be completed on time.
TSPI = (BAC – EV) / (BAC – PV), shows the schedule performance efficiency needed to complete the project on time.
Using CPI & SPI
Two key EVM indices are the Cost Performance Index (CPI) and the Schedule Performance Index (SPI). These key metrics will tell you how efficiently the project is using its planned budget and time.
As mentioned above, CPI is calculated based on the project’s Earned Value (EV) divided by the Actual Cost (AC). Essentially this is the value of work actually completed divided by the money you have actually spent to accomplish this work. CPI is shown as a single performance number:
CPI > 1.0 = Under budget. The project is getting more value per dollar spent than planned.
CPI = 1.0 = On budget. The project is getting the exact amount of value per dollar spent as planned.
CPI < 1.0 = Over budget. The project is getting less value per dollar spent than planned.
As a simple example, if your CPI is 0.80, this means that for every dollar spent the project is only getting 80 cents of value, a loss of 20 cents per dollar. If your CPI is 1.20, that means for every dollar the project spends it is getting $1.20 in value, a gain of 20 cents per dollar spent. The higher the CPI, the more productive and efficient the project is.
SPI likewise is calculated based on the project’s EV divided by its Planned Value (PV). This shows the value of work completed against the value of work planned to be completed by this point in the project. SPI is shown as a single performance number:
SPI > 1.0 = Ahead of schedule. The project has completed more work than planned.
SPI = 1.0 = On schedule. The project has completed the same amount of work as planned.
SPI < 1.0 = Behind schedule. The project has completed less work than planned.
As an example, if your SPI is 0.80, that means that the project has only completed 80% of the work planned for this point in time. If your SPI is 1.20, that means that the project has completed 20% more work than planned. It is important to recognize that with CPI and SPI a number greater than 1.0 is a positive indicator for the project.
Benefits of EVM
EVM ties together the planned work, actual work completed, and the actual cost so project performance can be measured in real time. EVM provides early visibility into potential issues that arise on a project, building off the CPI and SPI examples provided above, where we discussed that the SPI shows whether you are ahead or behind in actual work performed, not just behind on calendar days, while the CPI shows if you are getting the expected value for the money the project has spent, below we provide a simple matrix on what CPI and SPI values might be telling project management.
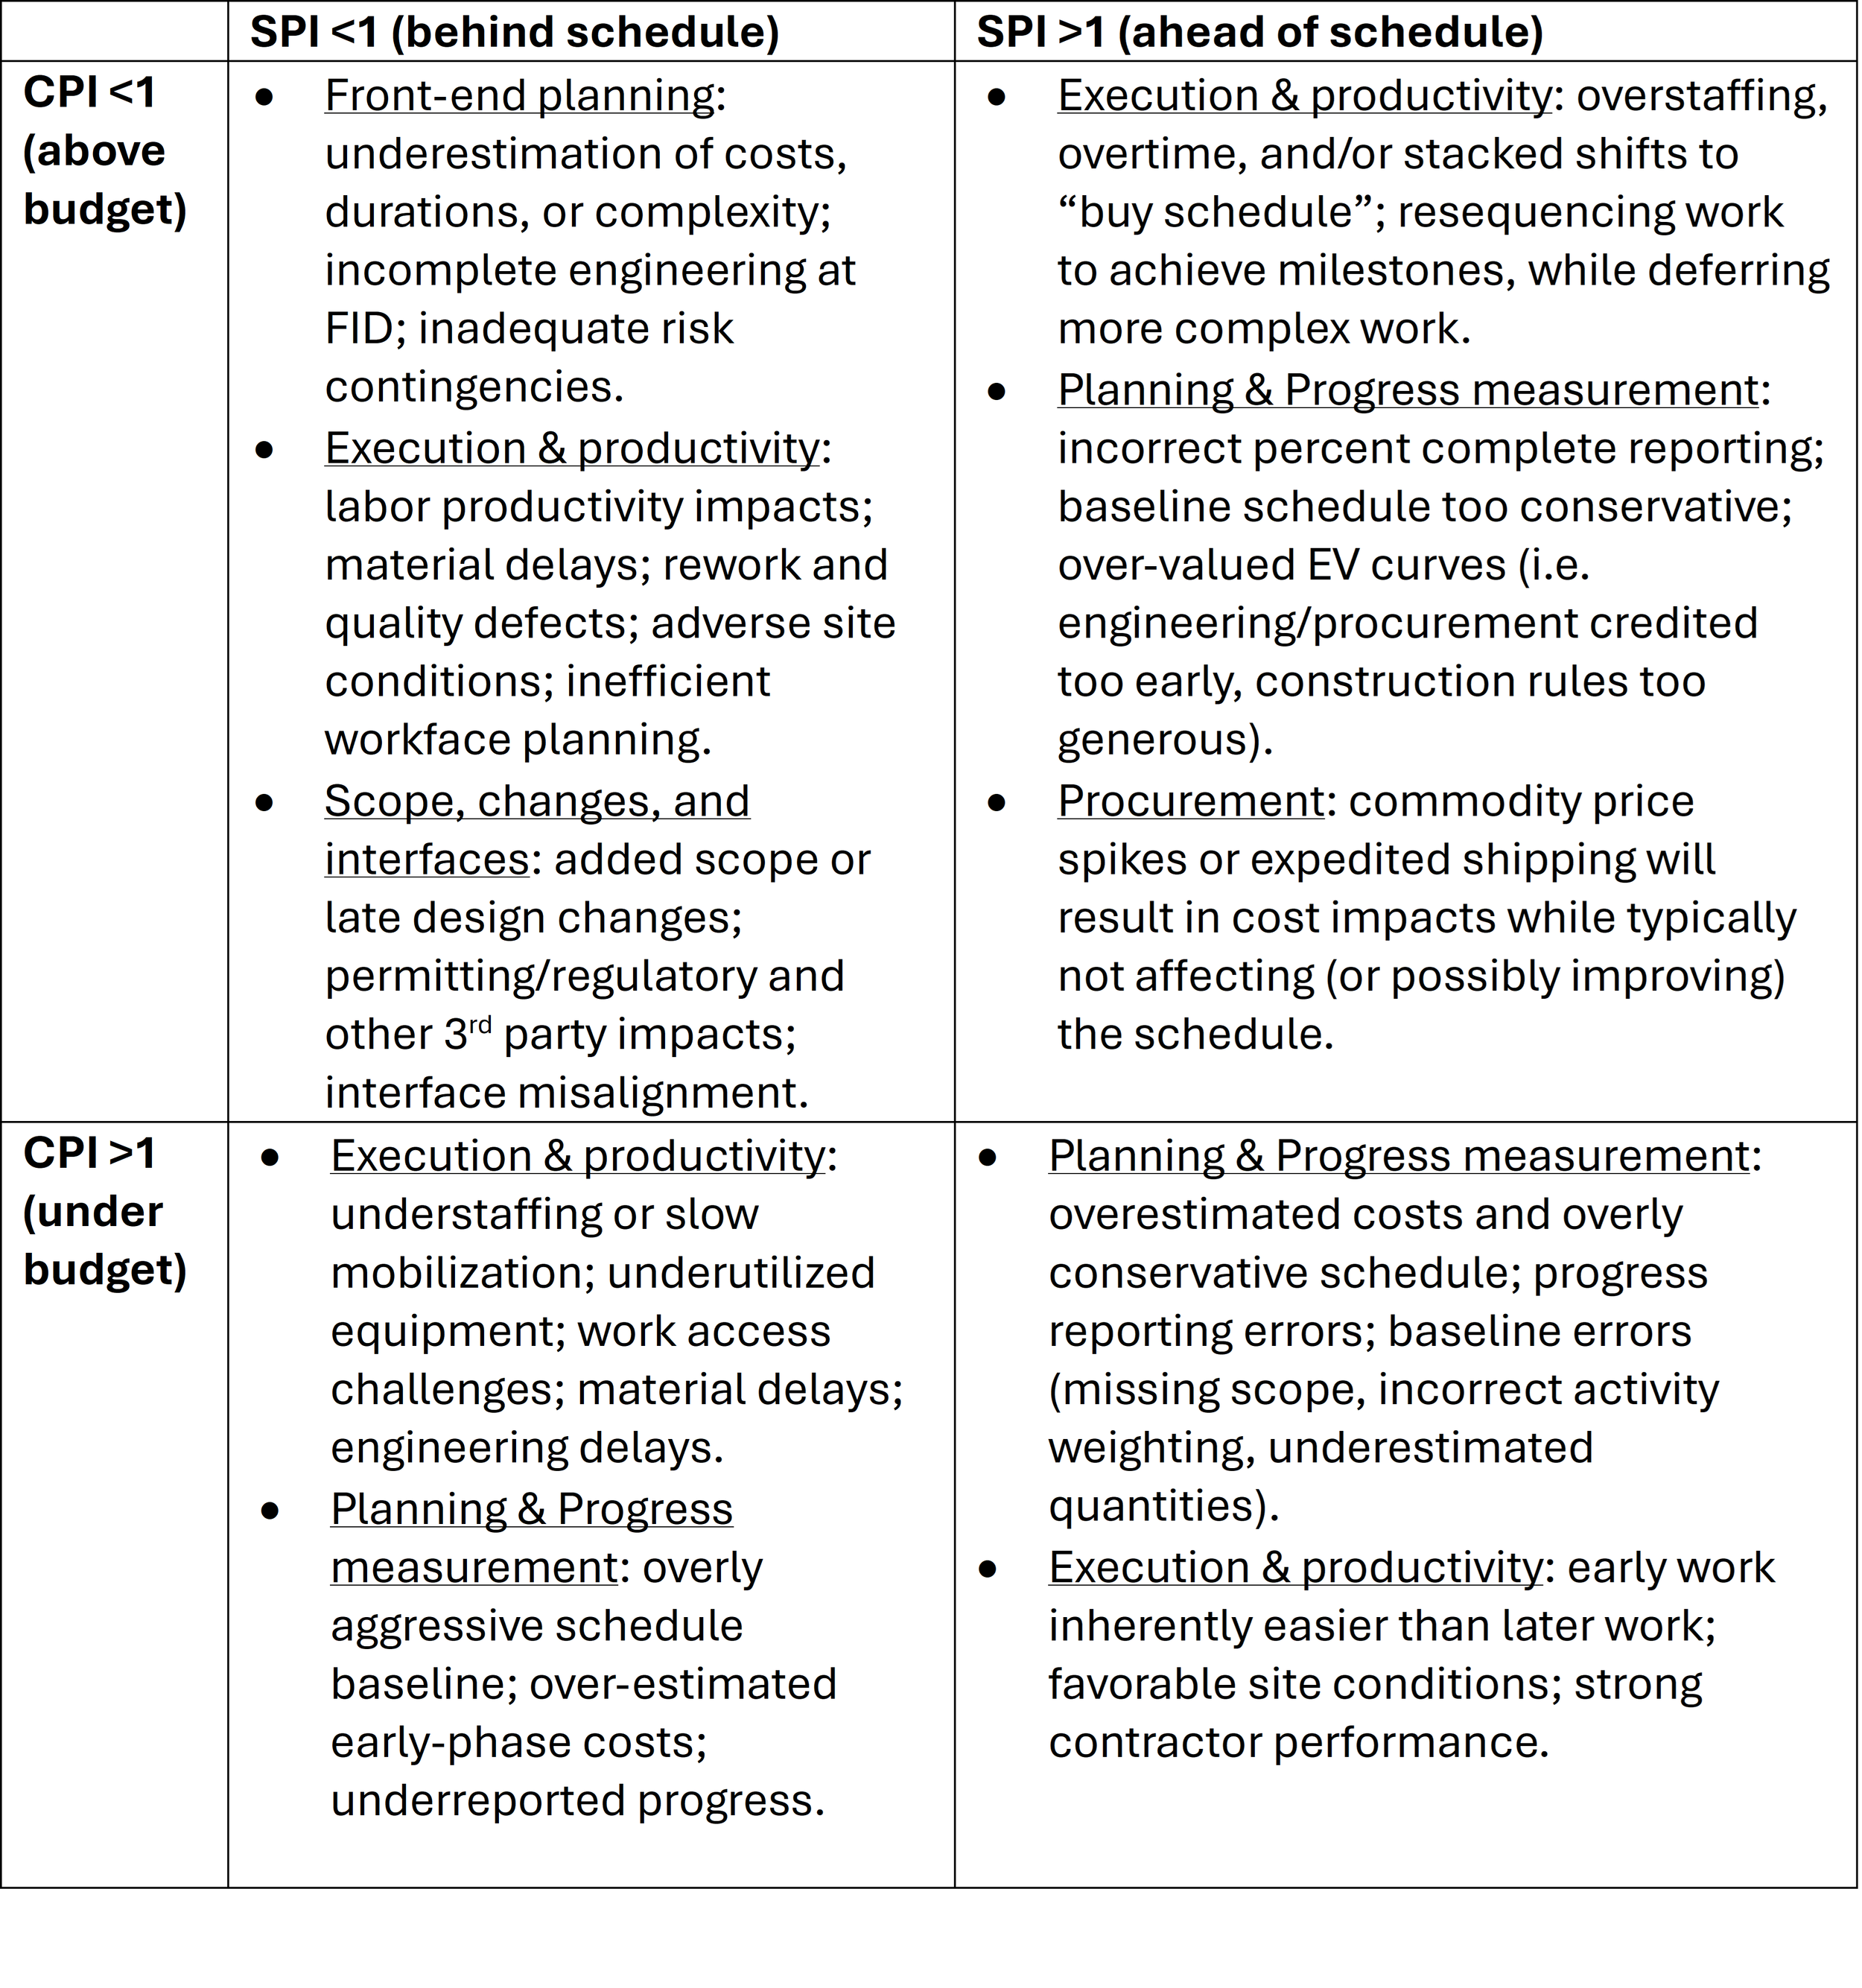
CPI & SPI matrix
Because EVM reveals early warning signs in real time to project management, before traditional cost and schedule reports would reveal the issues, it allows them to implement corrective actions sooner.
Another key advantage of EVM is it replaces subjective progress updates with objective data driven analysis, which reduces optimism bias and enables consistent reporting. Instead of relying on opinions, guesswork, or optimistic status updates and reporting, EVM uses quantitative comparisons of PV, AV, and EV to show real project performance. This also improves consistency across reporting metrics which allow leadership to compare performance across programs, underperforming projects can be flagged early, and organizational assets can be reallocated based on priority and project needs. Executives get strong performance indicators in CPI and SPI which allows them to understand the project’s health.
EVM can also prevent misleading interpretations of the actual progress on the project when schedule and cost are not aligned. For example, a project can appear to be tracking on under budget because it is behind schedule and the project has not spent as much money as it had planned to at this point in time. A project can appear to be ahead of schedule, but it has spent much more money to achieve that progress than initially planned. A project can also appear to be on track for both cost and schedule, but the project scope could have expanded requiring additional money and time to complete. These scenarios highlight why an integrated view of cost and schedule are essential to understand a project’s real status.
EVM Shortcomings
One of the shortcomings of EVM is that it only measures the quantity of work completed, not the quality of work performed. It is important to ensure that the project also maintains a robust quality program to ensure the work meets all quality requirements. It also does not measure how well the work performed conforms to the project requirements. Along with EVM, the project should be utilizing the requirements matrix to verify that the work completed matches the scope requirements.
EVM does not provide information into why a project is behind schedule or over budget, it simply tells you that you have a variance. As illustrated above, the project could be experiencing cost overruns due to poor labor productivity, high rework, underestimated work scope, or supply chain delays / cost increases. A project that is behind schedule could be experiencing contractor underperformance, poor work package sequencing, or permitting delays. The project teams will still need to perform root cause analysis to determine the causes of the cost and schedule variances. CPI and SPI being reported and tracked for individual crafts (civil, pipefitters, electricians, etc.) might also present more insight into where the project is experiencing issues.
Another drawback to EVM is it requires a well-defined scope and accurate baseline plans. Projects with shifting requirements, evolving designs, or frequent re-baselines will struggle to keep a meaningful baseline plan for comparison. The project baseline must be properly weighted for the performance metrics to be accurate. If the baseline schedule is unrealistic or the WBS activities are not weighted properly, both CPI and SPI can present distorted information that does not accurately convey the health of the project.
EVM can also impact work execution sequencing. Project management teams can focus on earnings instead of delivering value by chasing lower priority tasks to generate EV instead of focusing on critical activities in the schedule. EVM also requires discipline and buy-in by the organization and project team. An accurate and efficient EVMS can have a steep learning curve, a high setup and maintenance cost, increased project management overhead. Smaller organizations can often find the overhead of maintaining EVMS to outweigh the benefits that it produces.
Closing Thoughts
EVM offers a powerful, integrated approach for evaluating project performance by unifying scope, cost, and schedule into a single objective framework. By combining PV, EV, and AC, EVM enables project teams to identify variances early and gain visibility into emerging issues before they escalate. This data driven methodology replaces subjective progress assessments with consistent, quantifiable metrics, reducing optimism bias and improving the reliability of reporting.
EVM is most effective when the project is stable, the baseline estimates for cost and schedule are credible, and the project management team has the discipline and knowledge to maintain and execute EVM. It is least effective when the project scope is rapidly changing, the baseline estimates have high uncertainty, and the project team lacks the experience and knowledge to effectively utilize the EVM. When applied with discipline and supported by robust planning and quality processes, EVM enables organizations to better understand true project performance and maintain greater control over outcomes.